Question
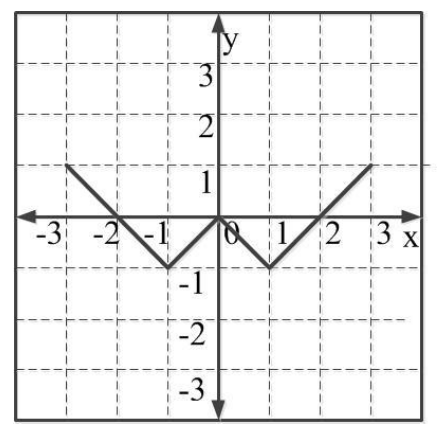
Which of the following functions describe the graph shown in the below figure?
Options :
𝑦 = ||𝑥| + 1| − 2
𝑦 = ||𝑥| − 1| − 1
𝑦 = ||𝑥| + 1| − 1
𝑦 = ||𝑥 − 1| − 1|
Show Answer
Answer :
𝑦 = ||𝑥| − 1| − 1
Solution :
From the given graph,
When x = 0, y = 0
x = ±1, y = -1
x = ±2, y = 0
x = ±3, y = 0
Now, let check the given options for the values of x = 0, ±1, ±2, ±3
For x = 0:
y = ||x| + 1| − 2 = -1 (fails)
y = ||x| − 1| − 1 = 0
y = ||x| + 1| − 1 = 0
y = ||x − 1| − 1| = 0
For x = ±1:
y = ||x| − 1| − 1 = -1
y = ||x| + 1| − 1 = 1 (fails)
y = ||x − 1| − 1| = 1 (fails)
For x = ±2:
y = ||x| − 1| − 1 = 0
For x = ±3:
y = ||x| − 1| − 1 = 1
Only y = ||x| − 1| − 1 satisfies the given graph
Report
More Similar Tests

